
DNS SURVEY: OCTOBER 2010
 PDF version
Geoffrey Sisson
© 2010
The Measurement Factory
Abstract
This study, commissioned by Infoblox, undertakes to measure the number of DNS servers on the Internet and to quantify their various DNS behaviors and configuration choices.
1. Introduction
In this study we undertook to measure:
- The number of name servers in use in a random 5% sample of the routed IPv4 Internet.
- The configuration of zones and associated name servers in a random 1% sample of the domains in the .com, .net, and .org zones.
- The implementations and versions of name server software used.
- Whether recursion is supported (i.e., open resolvers).
- Whether recursive name servers use predictable ports.
- Whether authoritative name servers openly permit AXFR.
- Whether name servers support TCP.
- Configuration decisions for DNSSEC.
- Whether DNSSEC-signed zones validate.
- How many name servers support EDNS.
- How many zones are configured for IPv6, SPF, or DKIM.
- How many zones have DNS wildcards.
- What SOA and TTL values are in use in a zone.
- Whether information in a zone agrees with its parent.
- Whether a zone has a lame name server.
- Whether the TTLs of the authoritative NS RRs for a zone match.
- To what degree redundant name servers are topologically diverse.
- How many name servers support 0x20.
- The geographic location of name servers.
2. Datasets
This survey comprises results of two distinct data sets. Dataset I is a random 5% sample of the routed IPv4 Internet. Dataset II is a random 1% sample of the domains in the .com, .net, and .org zones.
Dataset I — Random IP Addresses
To obtain Dataset I, we probed a random sample of all IPv4 addresses routed on the Internet. We began with an October 2010 snapshot of the global routing table taken from the Route Views Project with a total of 2,126,357,495 routed IPv4 addresses.[1] We then eliminated addresses ending in .0 or .2551 subnets associated with the .mil and .gov domains as well as a few subnets whose operators had previously requested to be excluded from scans. We then randomly selected 5% of the remaining IP addresses for our survey, yielding 105,497,945 IP addresses to probe.
Dataset II — Second-Level Zones in .com, .net, and .org
Dataset II contains name servers authoritative for a registered .com, .net, or .org domain. We treated this as a separate data set because the authoritative name servers are assumed to be more stable over time, better maintained, and more heavily used on average than randomly discovered name servers. Furthermore, this data set is used to study the adoption of new technologies in the DNS, namely IPv6, DNSSEC, DKIM, and SPF. We obtained zone files from VeriSign and Public Interest Registry (PIR) for .com, .net, and .org containing 90 million, 13.4 million, and 8.6 million domains respectively, and randomly selected 1% (1,122,518) to probe.
3. Results for Dataset I
Number of Nameservers
We sent a simple DNS query to each address in Dataset I asking for the IPv4 address for a.root-servers.net and with the RD bit set. A DNS response of any type (including SERVFAIL) was taken to indicate the presence of a DNS server. We did not implement timeouts and retransmissions, so the results are subject to packet loss; however the amount of packet loss is believed to be small, and to have had negligible impact on the results.
Table 1 summarizes the number of queries and replies.
| Dataset I | ||
|---|---|---|
| Hosts queried | 105,497,945 | |
| Hosts replying | 777,680 | 0.74% |
Table 1: Dataset I results.
Note that some addresses sent back more than one reply, even though we sent only one query. This occurs either because the probe address actually sends multiple responses for a single query, or because the reply source address may be different than the query destination address.2 Of the replying hosts, 23,738 (3.1%) were ones to which we never sent a query. This is in part attributable to network operators who intercept incoming DNS queries and forward them on to other hosts, which then respond using their own addresses.
Based on these figures we estimate that there are approximately 15,553,600 name servers on the Internet. This is a drop of 746,400 (4.6%) from last year's estimate of 16,300,000, in spite of the fact that 1,1131,893 (11.7%) more addresses were probed this year.
4. Name Server Software Versions
For each name server found in both data sets, we attempted to determine the name server software and version using a combination of two techniques. First, we used fpdns to fingerprint the server.[2] This typically results in a range classification of possible versions, for example "BIND 8.3.0-RC1 — 8.4.4". Second, we sent a version.bind query to the server to refine the fpdns result if and only if the version reported by version.bind fell in the range of possible versions as determined by fpdns. While we could have used version.bind queries alone, many name servers are configured to report an obfuscated result or no result at all.
Note that there are limitations to this approach:
- fpdns differentiates between implementations on a best-effort basis. Two implementations can look identical to fpdns and there may be no way to distinguish between them.
- fpdns has not been actively maintained in recent years.
- Even had fpdns been maintained, there has been a proliferation of commodity routers, firewalls and other "middleboxes" with no-name or proprietary DNS implementations that would be difficult to track.
As a consequence, the survey results contain false positive and false negative identifications, and should be interpreted with caution.
Figures 1, 2, and 3 summarize the distribution of name server software versions for Dataset I.
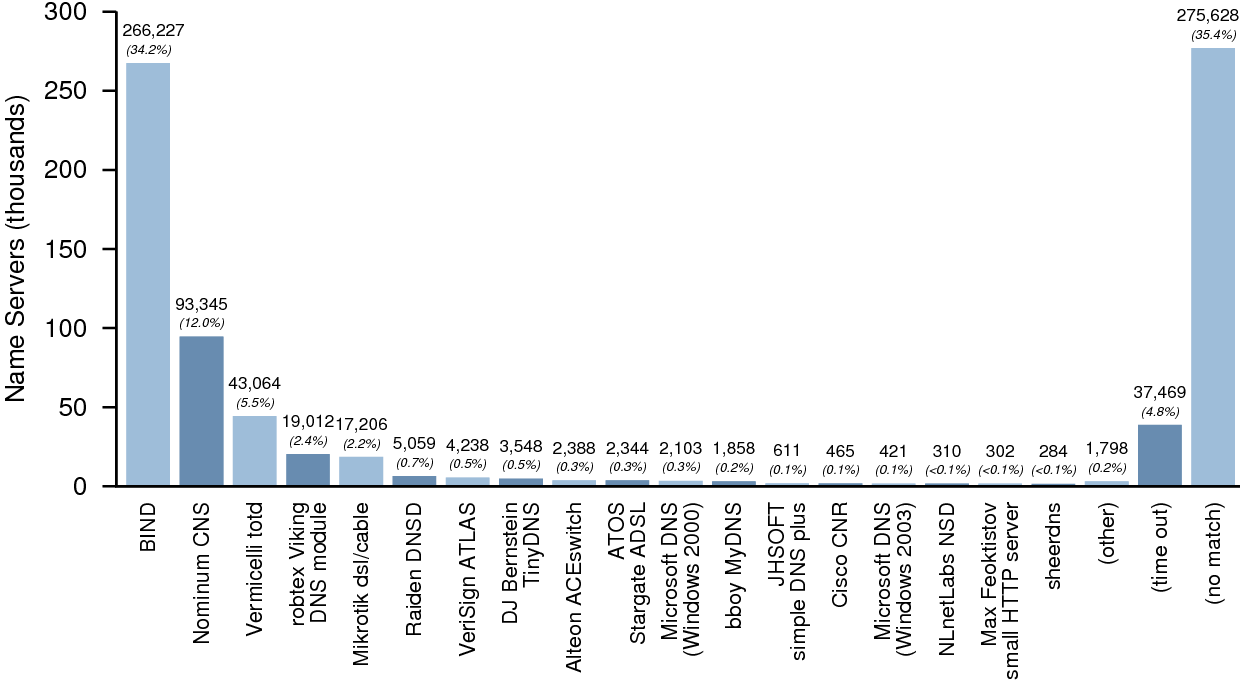
Figure 1: Distribution of name server software versions — Dataset I.
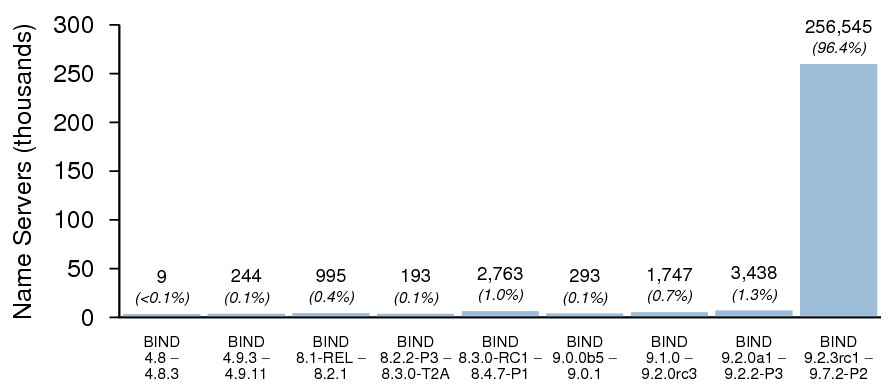
Figure 2: Breakdown of BIND versions — Dataset I.
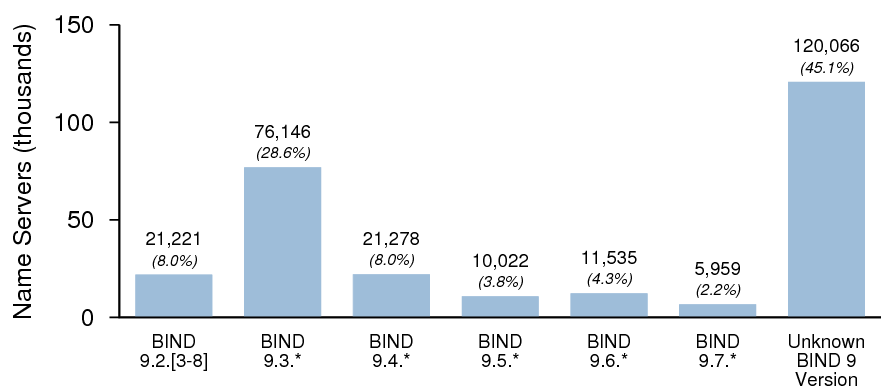
Figure 3: Breakdown of BIND 9 versions — Dataset I.
Figures 4, 5, and 6 summarize the distribution of name server software versions for Dataset II.
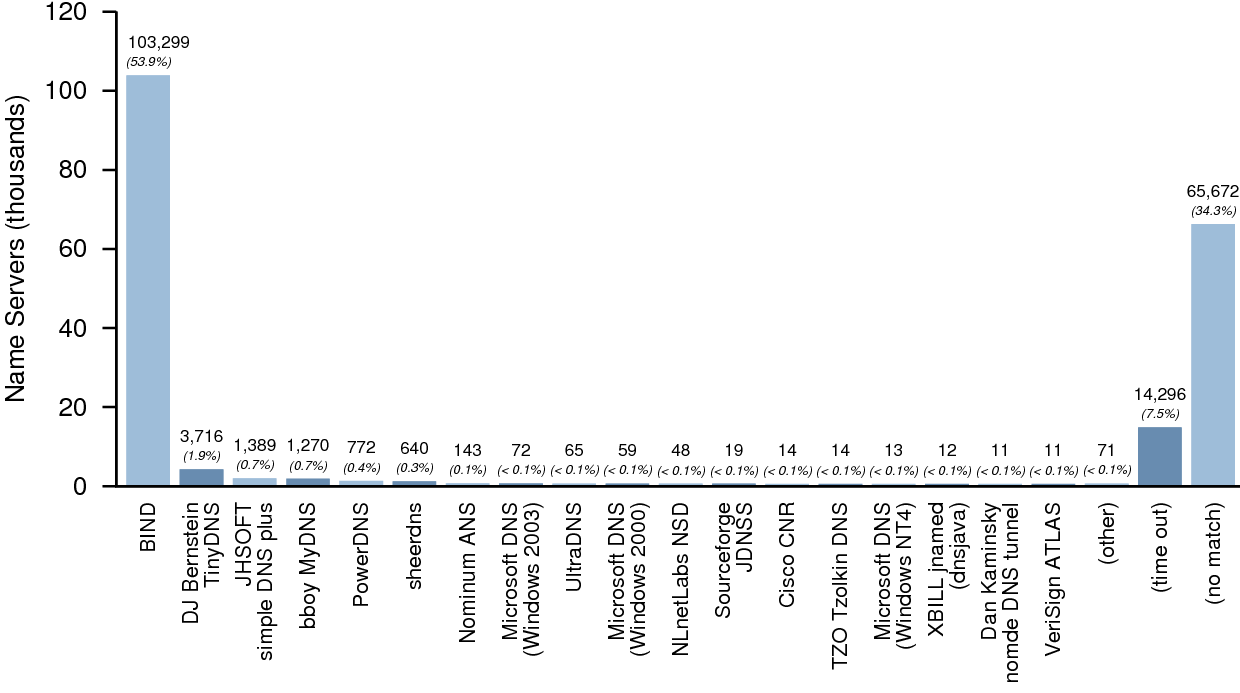
Figure 4: Distribution of name server software versions — Dataset II.
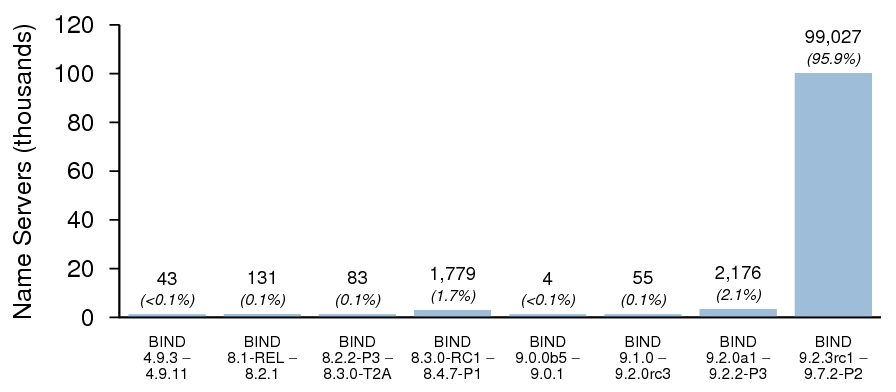
Figure 5: Breakdown of BIND versions — Dataset II.
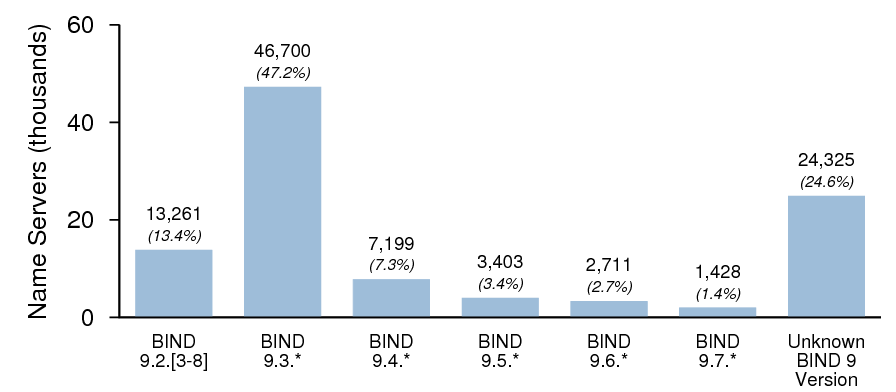
Figure 6: Breakdown of BIND 9 versions — Dataset II.
5. Open Resolvers
Interest in open resolvers derives from their potential use in DNS amplification attacks.[3] To test for open resolvers, we utilized a domain name we control, and then sent a specially crafted query for it to each responding name server in both data sets. Each query had an encrypted label with encoded values for the IP address of the original target host as well as the time of transmission. We then recorded incoming queries for the name and reconciled them with the original queries.
Open Resolvers in Dataset I
Of responding hosts in Dataset I, 596,025 (79.6%) returned valid replies in response to recursive queries. This is down slightly from last year's figure of 81.4%. Extrapolating to the entire address space, we estimate that there are as many as 11,920,500 open resolvers on the Internet.
After reconciling the incoming query sources with the original targets, we determined that most (96.6%) of these acted only as proxies, sending queries to other name servers for resolution.
In examining the distinct query sources, we found:
- 19,035 direct open "emitters", i.e., open resolvers from which we received queries from directly.
- 33,515 indirect open "emitters", i.e., hosts from which we received queries when we sent queries to a different host.
There was an overlap of 953 hosts between these two sets. In other words, we received queries from these hosts both when we queried them directly and also when querying other hosts. After taking this into account, we recorded a total of 51,597 distinct open emitters.
In estimating the number of open emitters on the Internet, there is little point in making a linear extrapolation from the above figure. Most of the query sources were not in the 5% sample, and it is likely that many of the same hosts would have responded given an entirely different sample set. However, we can establish a lower bound from the number of direct open emitters. Therefore we estimate that there are at least 380,700 open emitters on the Internet, comprising 0.02% of the routed address space.
The total number of open resolvers on the Internet appears to be decreasing with time, but it is still quite high. We urge developers and manufacturers to read and implement RFC 5625, DNS Proxy Implementation Guidelines.[4] Administrators should read and implement RFC 5358, Preventing Use of Recursive Nameservers in Reflector Attacks.[5]
Relationship Between Open Proxies and Resolvers in Dataset I
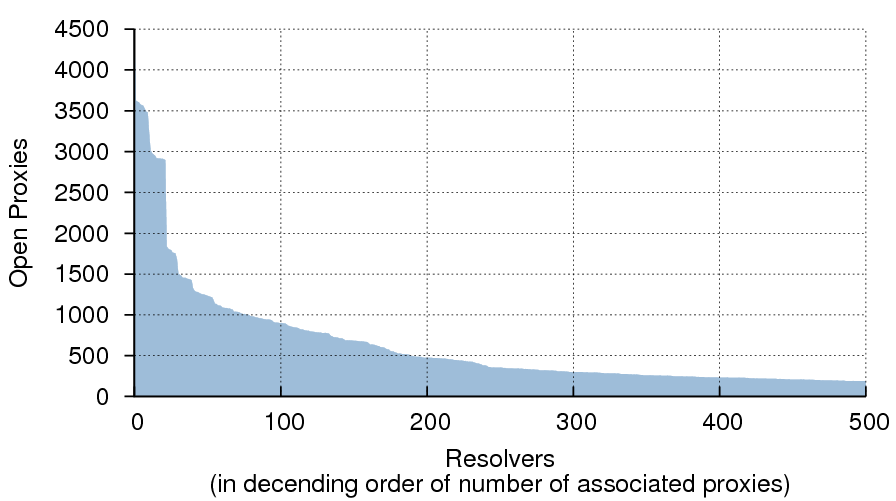
Figure 7: The many-to-some relationship between open proxies and resolvers.
Figure 7 characterizes the "many-to-some" relationship between open proxies and resolvers. More than 50% of the queries sent to the 592,145 distinct open proxies were resolved by just 232 resolvers. In total there were 33,515 resolvers acting on behalf of proxies. Note that it is unlikely that all of these are proxies in the strict sense of the term; some are almost certainly hosts with multiple IP addresses. However the incidence of this is probably relatively low, as only 13,064 (2.2%) of the observed proxy/resolver pairs were in the same /24 and only 44,660 (7.5%) were in the same /16.
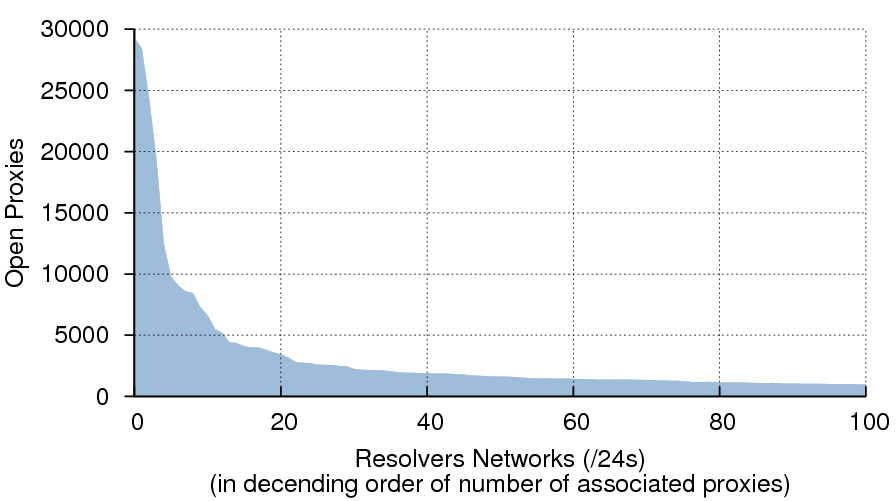
Figure 8: The many-to-some relationship between open proxies
and resolver networks.
The concentration of proxies to resolvers becomes even clearer when we look at the many-to-some relationship between proxies and resolver networks (Figure 8). More than 50% of the queries sent to proxies arrived back to us via resolvers on just 70 /24s.
Open Resolvers in Dataset II
Of the zones in Dataset II, 114,753 (10.2%) had at least one authoritative name server that is also an open resolver. This is up from last year's figure of 7.1%. Additionally, 93,304 (20.5%) of name servers from Dataset II had recursion enabled. This is down from last year's figure of 24.2%. One possible interpretation of these opposing changes is that there are fewer poorly configured authoritative name servers but comparatively more zones served by them.
In all, we found:
- 15,446 direct open "emitters", i.e., open resolvers from which we received queries from directly.
- 8,853 indirect open "emitters", i.e., hosts from which we received queries when we sent queries to a different host.
There was an overlap of 3,328 hosts between these two sets. In other words, we received queries from these hosts both when we queried them directly and when querying other hosts. After taking this into account, we recorded a total of 20,971 distinct open emitters, 10.9% of the name servers in Dataset II.
Unlike in Dataset I, many of the indirect emitters appear to be hosts with multiple IP addresses: 5,304 (59.9%) of them are on the same /24 as the proxy, and 4,014 (45.3%) are within the same /28. This would account for the substantial overlap between the direct and indirect emitters.
6. Source Port Randomization
Caching resolvers that send queries from predictable source ports are vulnerable to cache poisoning attacks. We examined the source port characteristics of the open resolvers we found in both data sets.
We wrote a daemon to listen for incoming DNS queries with a particular QNAME and return a reply with a CNAME reference to a name served by a second instance of the daemon. The second instance then returned a CNAME reference to a name served by the first. The process repeated until five queries had been received from the source 3, upon which the daemon returned an A RR.4
We then sent a specially crafted query to each open resolver in both data sets. As with the open resolver test, each query had an encrypted label with encoded values for the IP address of the original target host as well as the time of transmission. We then recorded incoming queries and reconciled them with the original queries.
The results have been divided into resolvers with clear patterns of port utilization and resolvers with no obvious pattern. We cannot say with certainty that a given resolver has good randomization as there is no reliable test for randomness (especially with a sample set of only five queries); however, if a resolver exhibits no obvious pattern, it is a good indication that the implementor has taken steps to randomize source port utilization.[6]
Port Randomization in Dataset I
The source port characteristics of the open resolvers in Dataset I are summarized in Figure 9. Note that this data set consists primarily of open DNS proxies and resolvers. Accordingly, it is unlikely that these are provisioned and maintained with the same hygiene as the majority of key resolvers used by ISPs and major organizations. As a result, they may have a higher incidence of poor source port randomization.
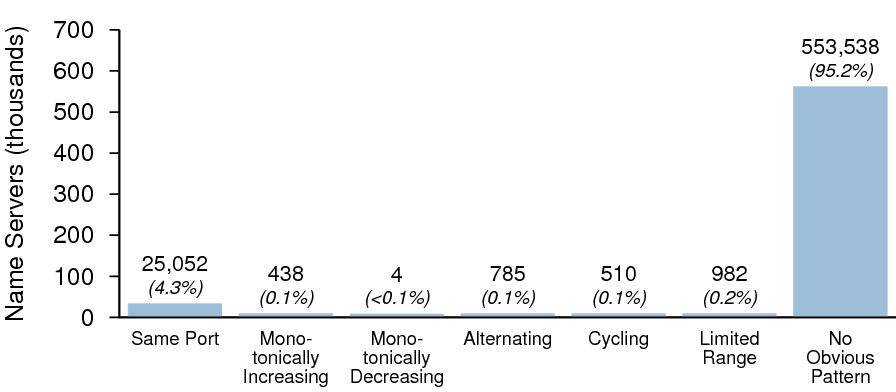
Figure 9: Source port randomization — Dataset I.
Of the open resolvers in Dataset I, 95.2% showed no obvious pattern; this is up from 89.8% in the 2009 survey. In effect, the number of servers with poor randomization was halved since last year's survey, a significant improvement.
Figure 10 shows the distribution of server software versions that exhibited poor port randomization. While BIND 9 ranks high on this list, this represents older versions of BIND 9 only; versions released on or after July 8, 2008 (9.5.0-P2 or greater, 9.4.2 or greater, and 9.3.5-P2 or greater) implement port randomization (although this can be overridden).[7]
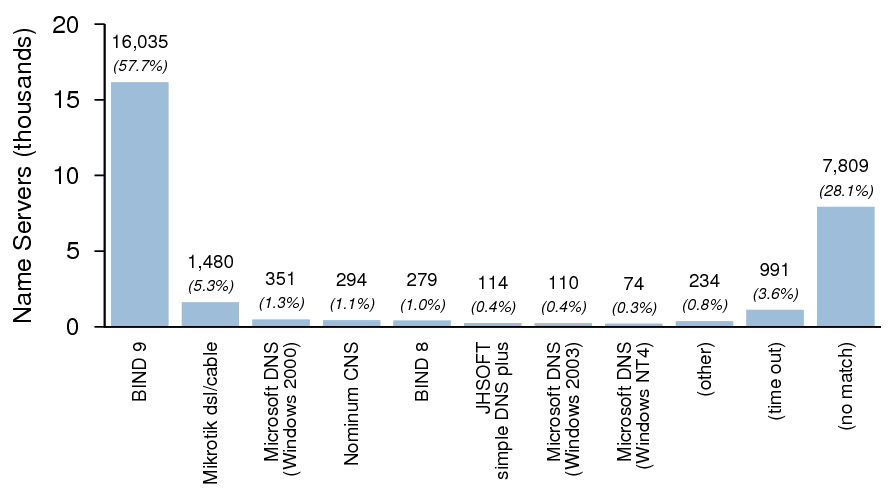
Figure 10: Name server software versions with apparently poor
port randomization — Dataset I.
Port Randomization in Dataset II
The source port characteristics of the open resolvers in Dataset II are summarized in Figure 11. As with Dataset I, it is unlikely that these servers are provisioned and maintained with the same hygiene as most key resolvers.

Figure 11: Source port randomization — Dataset II.
75.2% of open resolvers in Dataset II showed no obvious pattern; this is up from 65.9% in the 2009 survey, a significant improvement.
Figure 12 shows the distribution of server software versions that exhibited poor source port randomization. As noted above, BIND 9's high rank is likely due to older versions of BIND 9, as recent versions implement port randomization. Recent versions of PowerDNS Recursor also implement port randomization.

Figure 12: Name server software versions with apparently poor
port randomization — Dataset II.
7. Results for Dataset II — Authoritative Nameservers
The following tests are specific to Dataset II as they require knowledge of at least one zone for which a name server is authoritative.5
Zone Transfers (AXFR)
For each zone in Dataset II we tested to see whether one or more name servers permitted zone transfers. Table 2 shows the results. 11.3% of zones had a name server that permitted zone transfers, down from 15.8% last year.
| Count | Percent | |
|---|---|---|
| AXFR permitted | 114,050 | 11.3% |
| AXFR NOT permitted | 897,618 | 88.7% |
Table 2: Zones in Dataset II with at least one name server that permitted AXFR.
We also tested each name server in Dataset II to see whether each one individually permitted zone transfers. Table 3 shows the results. 26.1% of name servers permitted zone transfers, down from 32.3% last year.
| Count | Percent | |
|---|---|---|
| AXFR permitted | 50,004 | 26.1% |
| AXFR NOT permitted | 141,602 | 73.9% |
Table 3: Name servers for zones in Dataset II that permitted AXFR.
TCP Support
For each zone in Dataset II we tested to see whether one or more name servers permitted TCP-based DNS transactions. Table 4 shows the results. 83.6% of zones had a name server that accepted TCP, up slightly from 81.6% last year.| Count | Percent | |
|---|---|---|
| TCP permitted | 542,518 | 83.6% |
| TCP NOT permitted | 106,359 | 16.4% |
Table 4: Zones in Dataset II with at least one name server that permitted TCP-based DNS transactions.
| Count | Percent | |
|---|---|---|
| TCP permitted | 155,873 | 81.4% |
| TCP NOT permitted | 35,733 | 18.6% |
Table 5: Name servers for zones in Dataset II that permitted TCP-based DNS transactions.
8. DNSSEC
2010 has been a significant year for DNSSEC. On July 15th, the root zone was signed, removing one of the most significant barriers to broad DNSSEC deployment. However other obstacles remain:- The .com and .net zones are not yet signed.6
- Few registrars support DNSSEC.
- Few resolvers have DNSSEC validation enabled.
- The tools for managing signed zones are basic and typically entail a steep learning curve.
Consequently DNSSEC deployment is still extremely limited.
In Dataset II we found 243 DNSSEC-signed zones.7 Based on this figure, we estimate that 24,300 (0.022%) zones are signed in the .com, .net, and .org zones. Put differently, that is one in every 4,619 zones. While this is still a very small proportion, it represents a more than fourfold increase over last year's figure of 0.005%.
| TLD | Proportion of Signed Zones |
|---|---|
| .com | 0.020% |
| .net | 0.023% |
| .org | 0.040% |
Table 6: DNSSEC-signed zones, by TLD.
KSKs
Table 7 shows the distribution of key signing keys (KSKs) found for each signed zone. Note that no zones have pre-published KSKs.| Count | Percent | |
|---|---|---|
| No KSK (ZSKs only) | 1 | 0.4% |
| One KSK | 242 | 99.6% |
Table 7: KSKs per zone.
ZSKs
Table 8 shows the distribution of the number of zone signing keys (ZSKs) found for each zone. Last year more than half of signed zones had only one ZSK; this year the opposite is true.| Count | Percent | |
|---|---|---|
| One ZSK | 76 | 31.3% |
| Two ZSKs | 167 | 68.7% |
Table 8: ZSKs per zone.
Signature Validity Periods
Figure 13 shows the distribution of the signature validity periods found for the signed zones. Fractional values are typically indicative of zones employing online re-signing.
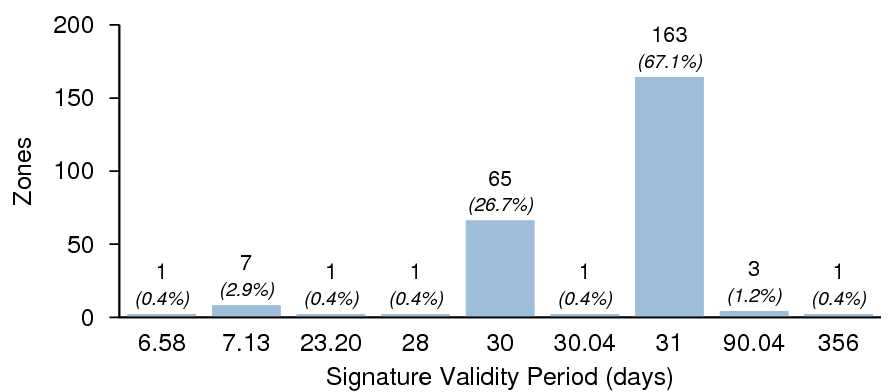
Figure 13: Signature validity periods.
KSK Properties
Figure 14 shows the distribution of KSK algorithms, key sizes, and exponent sizes. It is interesting to note that while nearly half of the signed TLDs (as well as the root zone) use RSA-SHA-256 or RSA-SHA-512, not a single zone in the sample used them. RSASHA1 offers more than adequate security for the foreseeable future, but zone managers deploying DNSSEC for the first time may wish to use RSA-SHA-256 or RSA-SHA-512 to avoid the inconvenience of a possible future algorithm rollover.
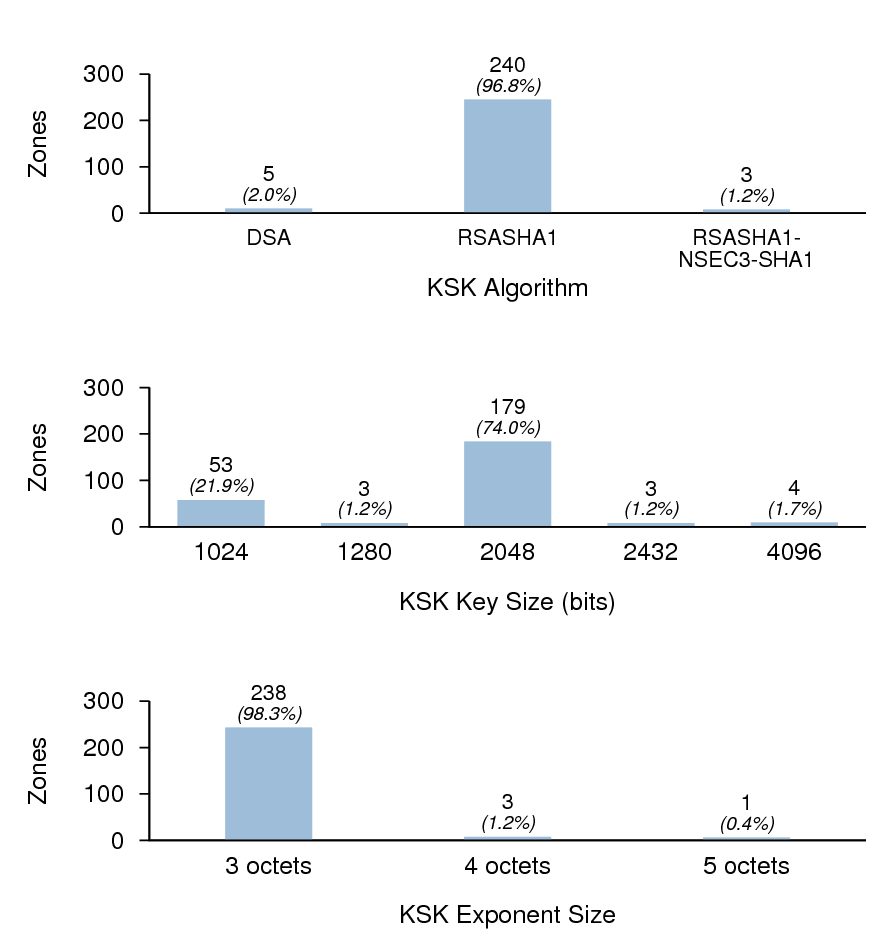
Figure 14: KSK properties.
All keys with three-octet exponent lengths had an exponent value of 65,537, or 10001hex (Fermat number F4). The keys with five-octet exponent lengths had an exponent value of 4,294,967,297, or 100000001hex (Fermat number F5). The keys with four-octet exponent lengths appeared to have exponents of random values that were, curiously, non-prime (with one exception).
ZSK Properties
Figure 15 shows the distribution of ZSK algorithms, key sizes, and exponent sizes.
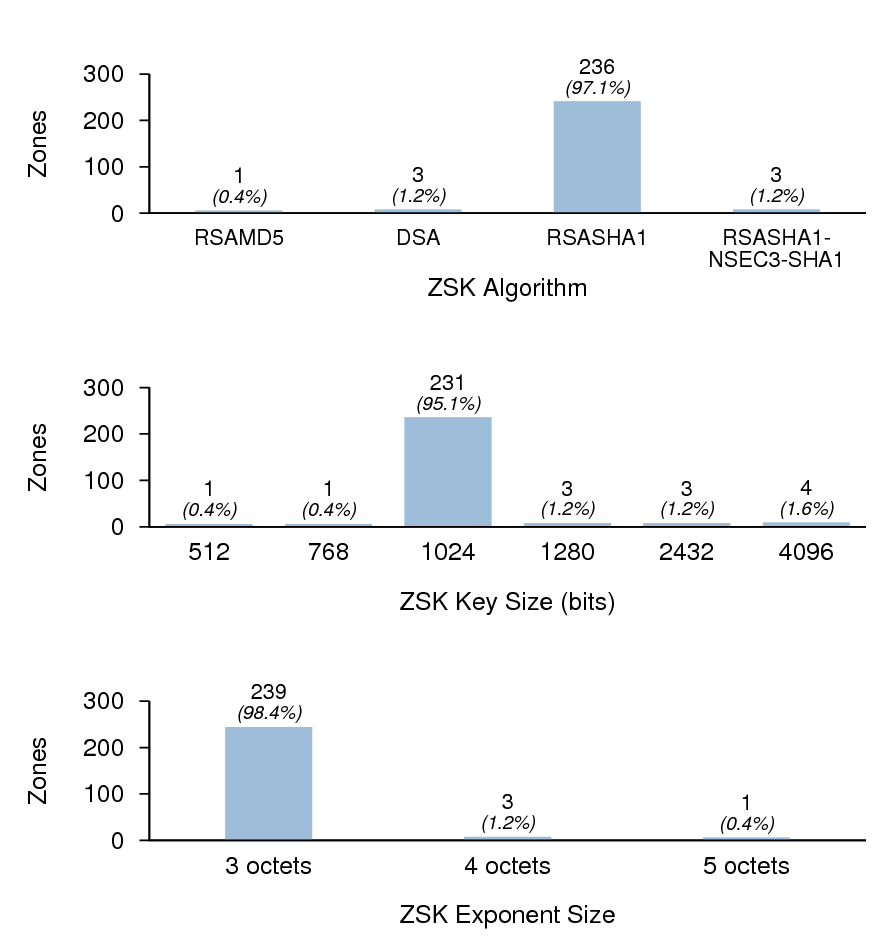
Figure 15: ZSK properties.
NSEC3

Figure 16: Zones using NSEC vs NSEC3.
Figure 16 shows the number of zones using NSEC3. Note that this is not the same as the number of zones with RSA-SHA1-NSEC3 KSKs, as one of the three zones with an RSA-SHA1-NSEC3 KSK is signed using NSEC RRs. Last year five out of 167 signed zones used NSEC3. While the sample size of signed zones is too small to draw any conclusions, it is possible that the use of NSEC3 in non-registry-class zones is dwindling.
DNSSEC Validation
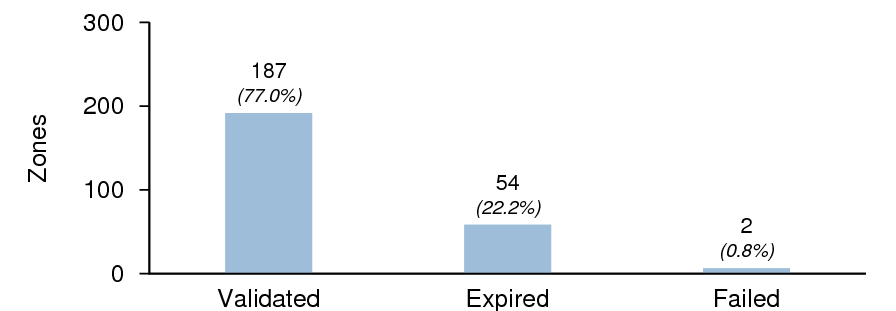
Figure 17: Validation statistics.
Figure 17 shows the validation status for the DNSSEC signed zones. Expired zones are zones that failed validation but were found to validate if the validator ignored the requirement for the current time to be within the validity period specified in the RRSIG RRs.

Figure 18: Trust anchors used.
Figure 18 shows the number of zones that validated against 1) the KSK within the zone itself, 2) the root zone trust anchor, and 3) ISC's DLV registry trust anchor. Of the TLDs included in this survey, only .org is signed, so only zones under the .org zone can be validated against the root zone trust anchor. Of the 34 signed zones in the .org zone, only nine had DS RRs in the parent zone; all of these zones validated against the root zone trust anchor. Four zones had DLV RRs in ISC's DLV Registry; all of these zones validated against the ISC DLV trust anchor. Of the two .org zones in the DLV registry, only one had a DS RR in the parent zone. No zone with either a DS RR in the parent or a DLV RR in the DLV registry failed to validate.

Figure 19: "Staleness" of expired zones (cumulative distribution).
Figure 19 shows the cumulative distribution of elapsed times for each expired zone since that zone expired. Some of these may be abandoned DNSSEC experiments that were never reverted to unsigned. Others may be attributable to zone managers who are unaware of the requirement to periodically re-sign the zone.
9. EDNS
We tested name servers in both data sets for EDNS support. EDNS is a prerequisite for DNSSEC, as replies containing DNSSEC metadata can easily exceed the legacy DNS message size of 512 octets. In order to properly support DNSSEC, a name server must not only have EDNS0 enabled, but it must have a payload size of at least 1,220 octets.

Figure 20: EDNS support — Dataset I.
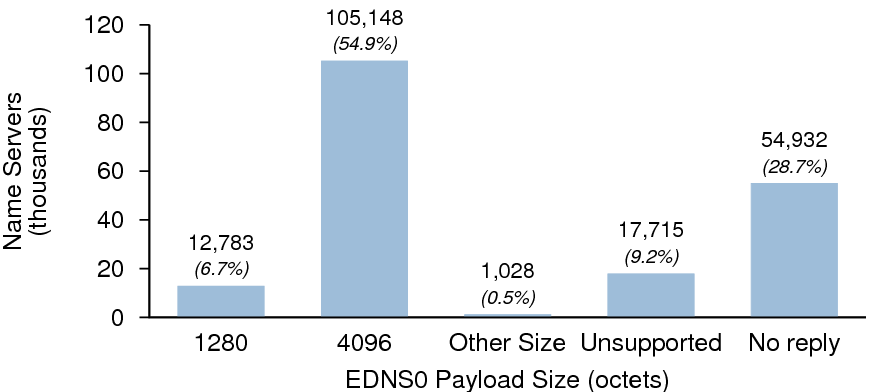
Figure 21: EDNS support — Dataset II.
Figures 20 and 21 show the EDNS payload sizes for the name servers in Dataset I and Dataset II respectively.
10. IPv6
We recorded the number of zones with at least one name server with an IPv6 address. VeriSign began accepting AAAA glue records for publication in the .com and .net zones in 2002, and PIR began accepting them for the .org zone in 2008. However, domain name registrars have been slow to extend their systems to accommodate these records. Therefore this statistic should not be interpreted as a meaningful indicator of the deployment of IPv6 in the global DNS.
| TLD | Count | Percent |
|---|---|---|
| .com | 10,762 | 1.2% |
| .net | 2,053 | 1.5% |
| .org | 1,532 | 1.8% |
| Total | 14,347 | 1.3% |
Table 9: Zones with name servers with AAAA RRs.
Table 9 shows the number zones with name servers that have AAAA RRs. The total of 1.3% is a significant increase over last year's figure of 0.7%.
11. SPF and Sender ID
Sender Policy Framework (SPF) and Sender ID are anti-forgery techniques by which organizations can list valid sources of email (e.g., IP addresses and host names) sent from their domain. They are described in RFCs 4408 and 4406.[8][9] To enable SPF authorization, an organization publishes an SPF record in their zone, either as an SPF (Type 99) resource record or as a TXT record. Mail transfer agents may then look up SPF information when receiving email messages. Sender ID is similar but, unlike SPF, has no assigned resource record type.
| Count | Percent | |
|---|---|---|
| Zones with SPF records (total) | 178,785 | 15.9% |
| TXT RRs | 178,732 | 15.9% |
| SPF RRs | 4,557 | 0.4% |
| Zones with Sender ID records | 771 | 0.01% |
Table 10: Zones with SPF/Sender ID records.
Table 10 shows the number of zones in Dataset II that were found to contain SPF or Sender ID records.
12. DKIM
DKIM is an anti-forgery technique by which organizations can sign mail to be validated against public keys published in their zone. It is described in RFC 4871.[10] To enable DKIM validation, an organization publishes one or more DKIM records as TXT records under the sub-domain _domainkey in the desired zone, e.g., key1._domainkey.example.com. Unlike SPF and Sender ID, DKIM records cannot be looked up directly without knowing — or attempting to guess — the key names; however, the presence of the subdomain _domainkey in a zone suggests that DKIM is configured.
| Count | Percent | |
|---|---|---|
| Zones with DKIM subdomains | 27,820 | 2.5% |
Table 11: Zones with DKIM subdomains.
Table 11 shows the number of zones in Dataset II that appeared to contain DKIM subdomains.
13. DNS Wildcards
Many administrators put DNS wildcards in their zones. Typical uses include receiving email for multiple subdomains and as a catch-all for misdirected connections. Wildcards are frequently found in the zones of "parked" domains to maximize the clickthrough rate to advertisers.
| Count | Percent | |
|---|---|---|
| Zones with DNS wildcard records | 470,197 | 41.9% |
Table 12: Zones with DNS wildcard records.
Table 12 shows the number of zones in Dataset II that appeared to contain DNS wildcards for at least one RR type.
14. SOA Values
We checked to see how many zones had SOA values within the ranges advised by RFC 1912 and other recommendations.[11]SOA Refresh
RFC 1912 suggests that the SOA Refresh value should be at least 1200 (20 minutes) and no larger than 43200 (12 hours); however RIPE-203 recommends a value of 86400 (24 hours).[12] Figure 22 shows the distribution of refresh values. 97.6% of zones have Refresh values in the recommended range if both recommendations are taken together.
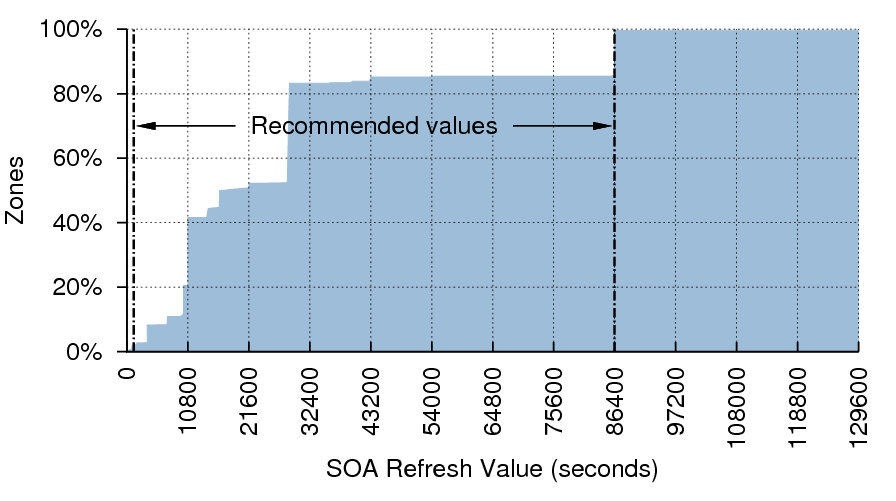
Figure 22: SOA Refresh values (cumulative distribution).
SOA Retry
RFC 1912 suggests that the SOA Retry value should typically be less than the Refresh value. Table 13 shows the distribution of Retry values relative to Refresh values.
| Count | Percent | |
|---|---|---|
| Retry ≤ Refresh | 947,539 | 98.7% |
| Retry > Refresh | 12,419 | 1.3% |
Table 13: Retry values relative to Refresh.
SOA Expire
RFC 1912 suggests that the SOA Expire value should be at least 1209600 (two weeks) and no larger than 2419200 (four weeks). RIPE-203 recommends a value of 3600000 (1000 hours, or 41 days). Figure 23 shows the distribution of expire values.
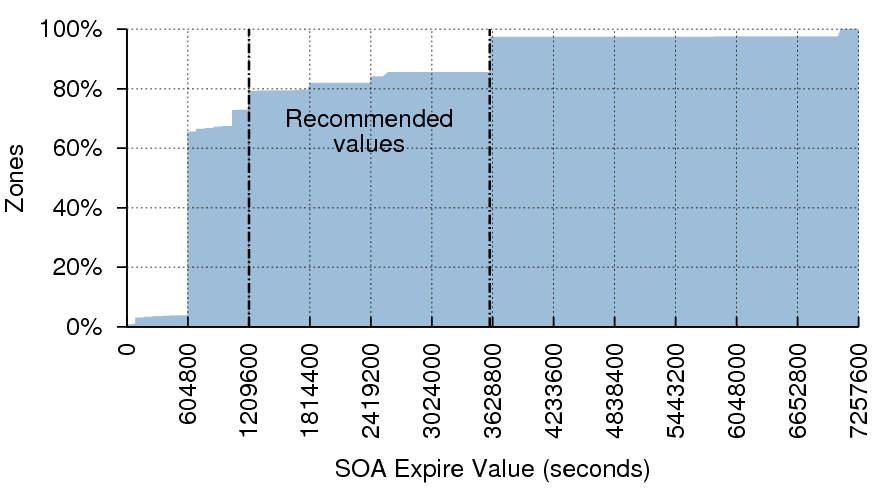
Figure 23: SOA Expire values (cumulative distribution).
Only 18.2% of zones in Dataset II have Expire values in the recommended range. In fact, most zones have an Expire value of 604800 (one week). This potentially puts them at greater risk of becoming unavailable during an extended outage. It should be noted that the Internet has changed considerably since these recommendations were made. It is rarer to find zones whose name servers are managed by separate entities. Consequently this value is less important than it once was. Nevertheless, the recommendations are still valid.
SOA Minimum
RFC 2308 advises that the SOA Minimum value (the TTL to be used for negative responses) works well when it is between 3600 (one hour) and 10800 (three hours).[13] This recommendation supersedes those in RFC 1912 and RIPE-203, which were written when the Minimum value had different (now deprecated) semantics. Figure 24 shows the distribution of Minimum values.

Figure 24: SOA Minimum values (cumulative distribution).
Surprisingly, only 22% of zones have Minimum values in the recommended range. Nearly 50% have a value of 86400 (one day). This is likely because many administrators are unaware of the change in semantics introduced by RFC 2308. However, common name server implementations usually enforce a negative caching limit of three hours or less, which mitigates the deleterious effects of large Minimum values.
SOA Serial Number
Non-matching serial numbers on different authoritative servers for a zone may indicate a configuration problem.
| Count | Percent | |
|---|---|---|
| Serial numbers match | 959,069 | 98.5% |
| Serial numbers DO NOT match | 14,240 | 1.5% |
Table 14: Zones with non-matching SOA serial numbers.
15. Matching of Authoritative NS Records
We tested to see whether delegation NS records (in the parent zone) match the authoritative NS records (in the child zone). We distinguish between "match", "not match", and the case where the supposedly authoritative name servers (learned from the parent zone) did not return any NS records for the zone. Table 15 shows the results. The number of mismatches was down slightly from last year's figure of 7.9%.
| Count | Percent | |
|---|---|---|
| Zones whose NS record match | 567,732 | 50.7% |
| Zones whose NS record are mismatched | 81,518 | 7.3% |
| Zones with no authoritative name server | 470,969 | 42.0% |
Table 15: Agreement between delegation and authoritative data.
16. Name Server Lameness
We tested for lameness by sending an SOA query for the zone to each authoritative name server. If the response's RCODE was anything other than zero (NOERROR), we surmised that the name server was lame. Table 16 shows the number of zones with at least one lame name server.
| Count | Percent | |
|---|---|---|
| Not Lame | 939,435 | 91.6% |
| Lame | 86,193 | 8.4% |
Table 16: Name server lameness.
Note that an unresolvable name server was not considered to be a lame server. In other words, if a zone had three name servers and we were unable to obtain an IP address for one of them, the zone was not considered to have a lame server provided that the other two name servers were not lame.
17. Matching of TTLs Across NS Records
RFC 1033 notes that all RRs with the same name, class, and type should have the same TTL value.[14] When the authoritative name servers for a zone have different TTLs, it is possible for name resolution to fail, particularly if the NS RRs with the longest TTLs are for lame or unreachable name servers. Table 17 shows the number of zones whose NS RRs all have the same TTLs vs the number that didn't.
| Count | Percent | |
|---|---|---|
| Zones w/ same TTLs for all NS RRs | 647,782 | 98.83% |
| Zones w/ NS RRs with differing TTLs | 1,129 | 0.17% |
Table 17: TTL mismatches.
18. Topological Dispersion of Name Servers
RFC 2182 advises that "secondary servers must be placed at both topologically and geographically dispersed locations on the Internet, to minimize the likelihood of a single failure disabling all of them."[15]
While we do not test for geographic diversity, we can evaluate the topological aspects of a zone's name servers. Topological proximity often belies geographic proximity: when two name servers are in the same /24 subnet, they are usually also geographically close to each other. Occasionally, anycast and other routing techniques make geographically distant hosts appear as if they are on the same subnet, but this is atypical.
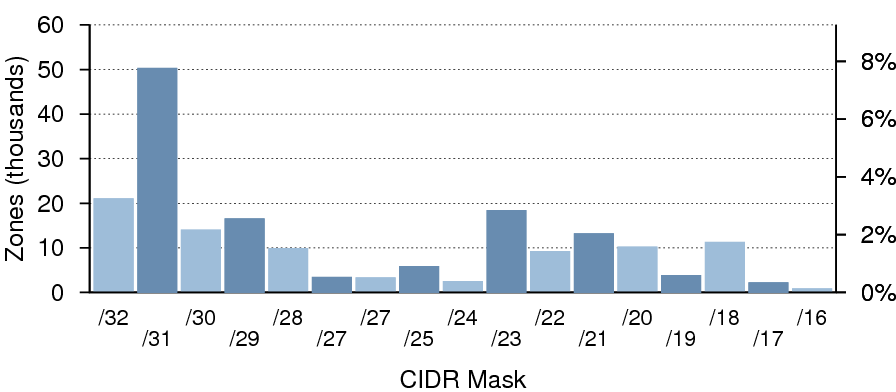
Figure 25: Topological dispersion of name servers — Dataset II.
Figure 25 shows the number of zones having all their authoritative name servers within a given CIDR-sized subnet.
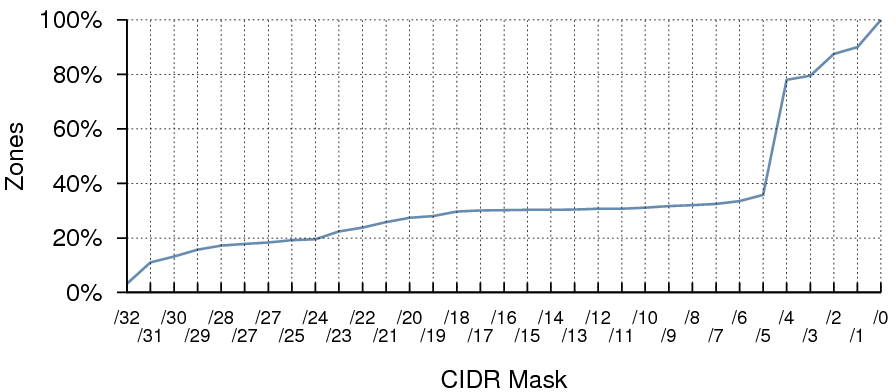
Figure 26: Topological dispersion of name servers — Dataset II
(cumulative distribution)
Figure 26 shows the cumulative distribution of zones having all their authoritative name servers within a given CIDR-sized subnet. 19.5% of zones have name servers that are wholly contained within the same /24 subnet, which is particularly undesirable.
19. Autonomous System Diversity of Name Servers
BGP routing interruptions, while infrequent, are one of the more common causes of transient unreachability between two hosts. To ensure maximum reachability, a zone's name servers should be split across at least two Autonomous Systems (ASes).
To determine the AS of each name server in Dataset I, we used a copy of the CAIDA Routeviews Prefix to AS Mappings Dataset (pfx2as).[16] We then noted the number of distinct ASes used by the authoritative name servers for each zone.

Figure 27: Number of zones having all of their authoritative
name servers within a given number of Autonomous Systems.
Figure 27 shows the number of zones having all of their authoritative name servers within the given number of Autonomous Systems. Over 72% of zones have all of their name servers in one AS only. If a routing issue arises between the AS containing the zone's name servers and another AS, hosts in the other AS will be unable to resolve the domain. Most Internet users experience this type of interruption on occasion, usually without knowing the cause.
Note that in a small number of cases, all of the name servers for a zone are in a single AS that achieves sufficient resilience via IPv4 anycast routing.[17]
20. 0x20 Behavior
One proposal for improving the resilience of DNS resolvers against forgery involves utilizing the high bit of the alphabetical characters in the QNAME as additional entropy in DNS transactions.[18] This proposal is generally referred to as 0x20.8 This technique requires that name servers preserve the case of characters in the QNAME in the Question section of a DNS reply.
0x20 Behavior in Dataset I
We sent a query for A.rOOT-SerVeRs.NEt to each responding host in Dataset I to see whether the case was preserved in the reply. Figure 28 shows the results. "Other" means the name server returned a reply that contained a DNS header only, e.g., REFUSED or SERVFAIL. The 0x20 behavior could not be determined for these hosts as no Question section was present in the reply.

Figure 28: 0x20-ready name servers — Dataset I
The large number of timeouts is likely due to the test for 0x20 behavior being run a week after the initial probes to establish Dataset I. As many name servers in Dataset I have ephemeral IP addresses, these timeouts probably reflect IP address changes during the interim rather than failure to reply to queries with mixed-case QNAMEs.
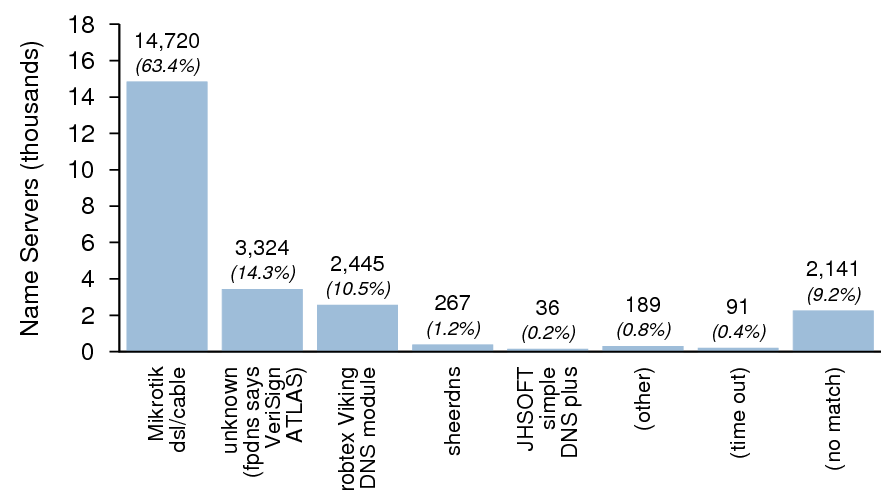
Figure 29: Distribution of name server software versions
that are not 0x20-ready — Dataset I.
Figure 29 shows the distribution of server versions that did not support 0x20 in Dataset I. Note that the implementation labeled "unknown" was reported by fpdns to be VeriSign ATLAS; however nearly all of these hosts have version.bind values that suggest that they are older versions of BIND 9. These hosts were concentrated in a relatively small number of networks, and may be patched versions of BIND, or some variant of BIND. Alternatively, they may be proxies that are downcasing QNAMEs before (or even after) they reach a BIND server.
0x20 Behavior in Dataset II
For each name server in Dataset II, we sent a query for the SOA RR of a zone for which it was authoritative. For a QNAME containing n letters, we set ⌊ n / 2 ⌋ random letters to uppercase and left the remaining letters as lowercase .
Figure 30 shows the results. Again, "Other" means the name server returned a reply that contained a DNS header only.
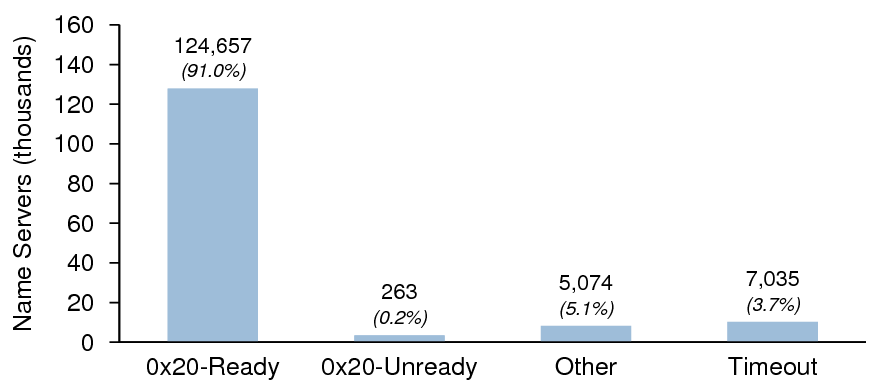
Figure 30: 0x20-ready name servers — Dataset II.
Figure 31 shows the distribution of server versions that did not support 0x20 in Dataset II. It is remarkable that only two identifiable implementations were found not to support 0x20 in Dataset II.
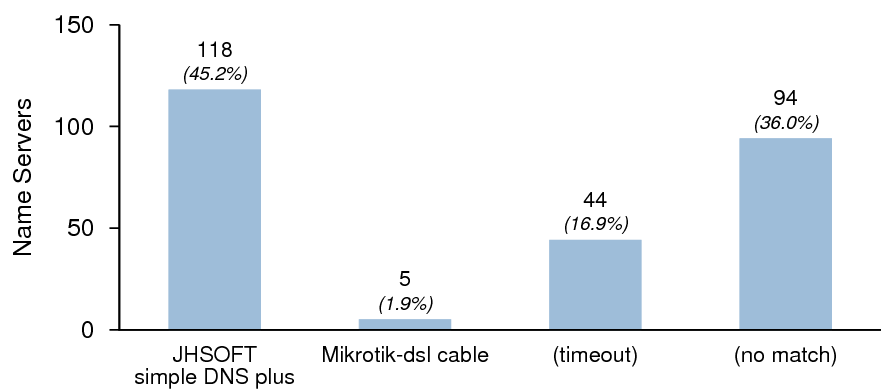
Figure 31: Distribution of name server software versions
that are not 0x20-ready — Dataset II.
21. Geographic Location
We used a recent copy of the MaxMind GeoIP Country geolocation database to determine the location (by country) of the name servers in both datasets.[19] We then compared these with the address space in use by each country (via the Routeviews and GeoIP datasets) to estimate the name server density for each country.
Name Server Location
Figure 32 shows the distribution of the top 60 countries with responding name servers from Dataset I.
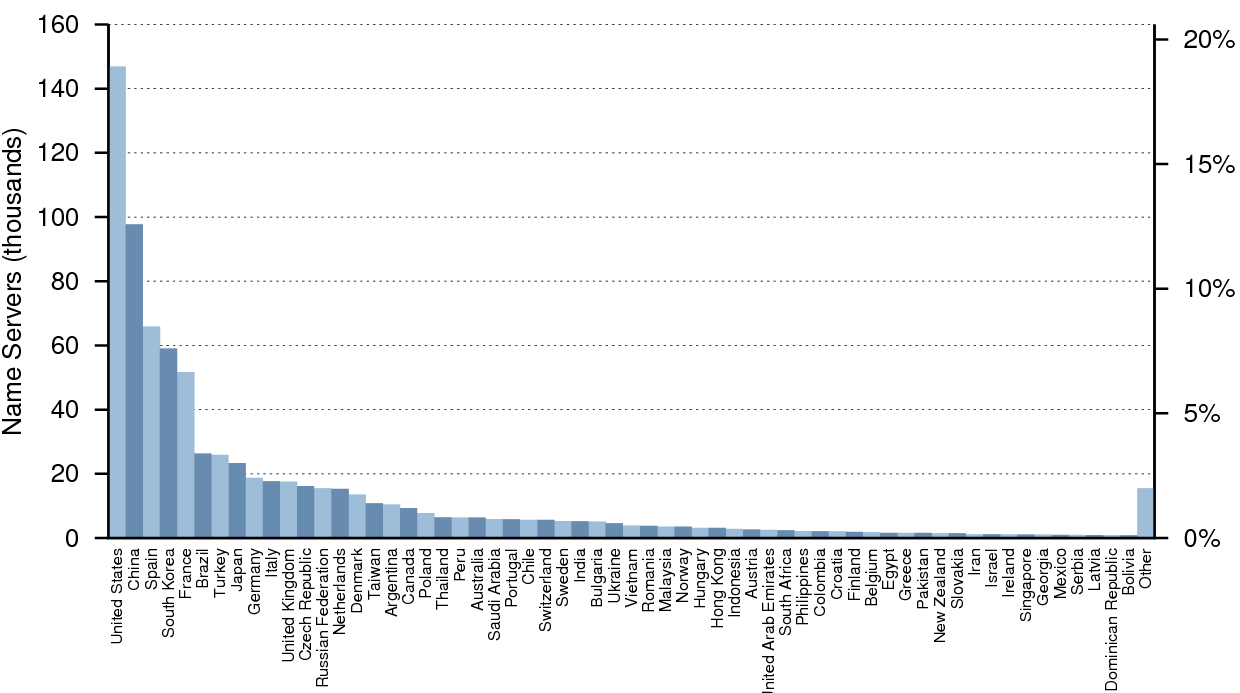
Figure 32: Geographic location of name servers — Dataset I.
Figure 33 shows the distribution of the top 60 countries with responding name servers from Dataset II. Note that this plot has a broken y-axis, and that the number of name servers in the United States is actually more than ten times the number in the United Kingdom or Germany, the next closest countries.
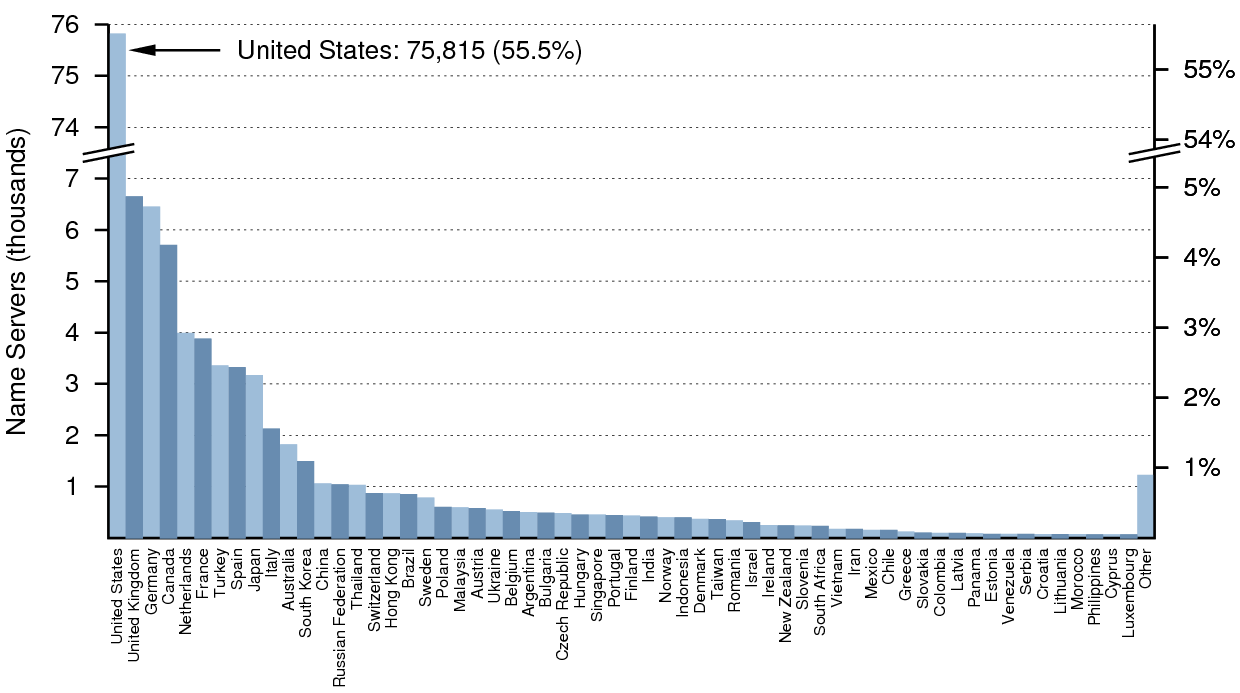
Figure 33: Geographic location of name servers — Dataset II.
Name Server Density
Figure 34 shows the estimated density for the top 60 countries (by name server count in Dataset I) with respect to their allocated and routed address space. There were countries with greater densities than those shown here; however, in most cases this was due to a country with very few servers having proportionately even less allocated address space. It therefore made sense to focus on the countries with the most name servers.
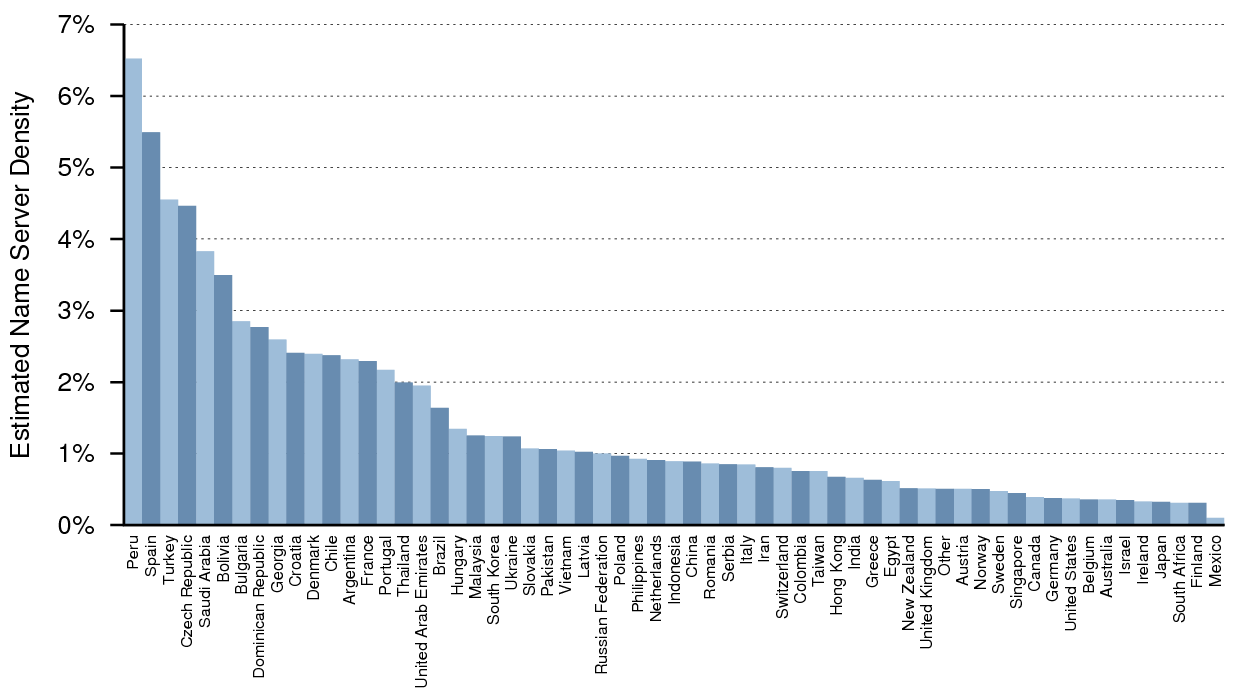
Figure 34: Density of name servers by country — Dataset I.

Figure 35: Density of name servers by country — Dataset II.
References
- ^ University of Oregon Route Views Project
- ^ fpdns.
- ^ Scalzo, F., Recent DNS Reflector Attacks From the Victim and the Reflector POV, presented at NANOG 37, May, 2006.
- ^ Bellis, R., DNS Proxy Implementation Guidelines, RFC 5625, BCP 152, August 2009.
- ^ Damas, J. and F. Neves, Preventing Use of Recursive Nameservers in Reflector Attacks, RFC 5358, BCP 140, October 2008.
- ^ Laurie, B., Is Your DNS Really Safe?, July 2008.
- ^ Internet Systems Consortium, DNS Cache Poisoning Issue ("Kaminsky bug"), (ISC Advisory), July 2008.
- ^ Wong, M., and W. Schlitt, Sender Policy Framework (SPF) for Authorizing Use of Domains in E-Mail, Version 1, RFC 4408, April 2006.
- ^ Lyon, J., and M. Wong, Sender ID: Authenticating E-Mail, RFC 4406, April 2006.
- ^ Allman, E., et al., DomainKeys Identified Mail (DKIM) Signatures, RFC 4871, May 2007.
- ^ Barr, D., Common DNS Operational and Configuration Errors, RFC 1912, February 1996.
- ^ Koch, P., Recommendations for DNS SOA Values, ripe-203, June 1999.
- ^ Andrews, M., Negative Caching of DNS Queries (DNS NCACHE), RFC 2308, March 1998.
- ^ Lottor, M., Domain Administrators Operations Guide, RFC 1033, March 1987.
- ^ Elz, R., et al., Selection and Operation of Secondary DNS Servers, RFC 2182, July 1997.
- ^ CAIDA Routeviews Prefix to AS mappings Dataset.
- ^ Abley, J. and K. Lindqvist, Operation of Anycast Services, RFC 4786, BCP 126, December 2006.
- ^ Vixie, P., and D. Dagon, Use of Bit 0x20 in DNS Labels to Improve Transaction Identity, Work in Progress, March 2008.
- ^ MaxMind GeoIP Country Database.
FOOTNOTES
- ^ While these can be valid host addresses, in practice they are infrequently assigned.
- ^ In a few cases, large numbers of replies were sent from what could be described as "DNS bombs": hosts that appeared to be designed to send an unending stream of replies to the source address of a query. We suspect that these are malware-infected hosts intended for use in DDoS attacks.
- ^ The sequence number of the query was encoded into the CNAME reference.
- ^ We limited the test to five queries as at least one well-known resolver detects a loop on the sixth lookup and returns SERVFAIL.
- ^ There is no straightforward method to discover what zones are served by an arbitrary name server.
- ^ VeriSign has announced that the .net zone will be signed in December and the .com zone will be signed in March, 2011.
- ^ Four additional zones were found to contain DNSKEY RRs but were unsigned.
- ^ 0x20 refers to the position of the bit that differentiates uppercase from lowercase characters in ASCII.
© 2020 The Measurement Factory.